
| Home Page |
Books |
Hobbies |
Box Room |
Philosophy |
Pictures |
(Click on the smal pictures embedded in the text to obtain larger ones, and click again to resume reading this page.)
Two at first sight disparate ideas that turn out to be intimately linked.
Chaos is behaviour unpredictable because it is of infinite complexity
A fractal is a figure of infinite complexity.
The two are linked because a geometrical representation of chaos takes the form of a fractal.
Not equivalent
Until quite recently it was assumed that these were equivalent, but we are gradually finding more and more cases where determinism does not guarantee predictability.
There are two ways in which a system may be predictable.
(1) By analysis of structure
(2) By observation of behaviour
(P1)A system may be predictable by analysis of structure, for example we may be able to predict the behaviour of a machine by tracing the interaction of its parts.
(P2) Even if the structure is unknown, or too complicated to analyse, a system may still be predictable because we observe a regular pattern in its behaviour, like observing that the cat comes indoors when it rains.
An example of (2) without (1) Knuth's random number algorithm.
Statisticians often want to take what they call random samples, and one way of doing that is to select a sample by using random numbers, or strictly speaking pseudo random numbers.
In Seminumerical Algorithms Donald Knuth described a most complicated piece of numerical juggling that starts with a so called seed number supplied by the user, and after multiple contortions which it takes a full page of mathematical formulae to describe, generates a sequence of numbers. The first time the algorithm was tested the output was:
6065038420, 6065038420, 6065038420, 6065038420, 6065038420, …….
Although the process was impossible to analyse in detail, its output was eminently predictable by those who had seen it in action
Until quite recently it was widely assumed that complexity of the underlying system was the only barrier to successful prediction, but then cases started to turn up where even relatively simple systems that looked as if they should have been easy to analyse, could not be made to yield useful predictions. The problem was not complexity, but an unavoidable accumulation of errors.
Several studies of systems we now recognise as chaotic were made by Henri Poincaré, though he may not have quite realised that they were all instances of one pervasive problem.
Planetary Orbits
In the simple case of just a single planet moving around the sun, Newton"s Laws of motion imply that the planet will move in an Elliptical orbit; the derivation is easy enough to be included in the school curriculum, but with more than one planet the system is too complicated to be described by any simple mathematical equations or simple geometrical figures. To a close approximation and in the short term the planets of the Solar Seem move in elliptical orbits, with slight changes to the ellipse with each rotation. Considered over a period of many millions of years a planet moves along a curve that frequently crosses itself without ever exactly repeating itself.
A good deal of information about the three body problem, illustrated by useful simulations, is available here:
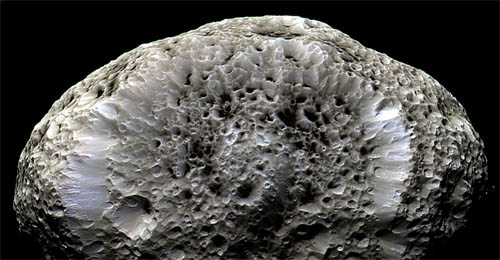
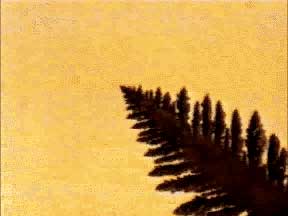
In the case of Hyperion, one of the fifteen moons of Saturn, we can see the chaos in operation if we look, not at its orbit, but at its orientation. Hyperion is the largest planetary body to deviate substantially from a spherical shape, and as it orbits Saturn it turns and tumbles in a way that defies prediction, though the position of Hyperion in its orbit is predictable. Thus if anyone lived on Hyperion there would be no regular succession of day and night. There would at best be daylight forecasts with a similar reliability to our terrestrial weather forecasts.
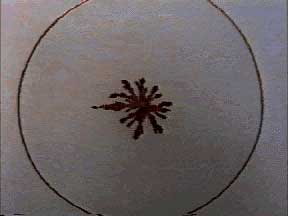
Poincaré attempted to determine whether or not the solar system is stable, and began by considering a special case called Mills' simplification, in which there are just three bodies, one of them so small that it would not affect the motion of the other two, which would therefore move in ellipses about their common centre of gravity. The third, small body would often move chaotically along an extremely complicated path so that its position defies prediction. We now recognise such a path as fractal. Such a system need not always behave chaotically. Stable orbits are possible, but I get the impression that stable orbits are the exception and chaos is the general rule.
The first picture shows a stable orbit, the second shows chaos.
The formal study of chaos began when Edward Lorenz, working on computer generated weather forecasting, re-ran a computer program with what he believed to be the same data as before, and was surprised to find that he obtained quite different results. On checking he realised that the data used the second time were not quite the same as on the first run, because he'd rounded them to fewer decimal places. That approximation in the data had not just produced a minor change in the output, it had produced completely different output.
Weather is a tricky example because the genesis of weather is complicated, involving the interaction of many factors, but that complexity is not the source of the chaotic behaviour. Chaos follows from are now called the Lorentz equations, which are quite simple equations describing the transfer of heat in a gas by convection currents. Even simplified models of the weather are chaotic.
Chaos is not the result of complexity: Even simplified models of the weather are chaotic.
We cannot avoid chaos by ncreasing the accuracy of our measurements because chaos arises from a process that magnifies errors. I don't know the precise figures, but I suspect that increasing the accuracy of meteorological measurement by an extra decimal place would increase the period for which a weather forecast is valid by at most two or three days. If that is so, increasing the period of validity by a year, would require an extra hundred or more decimal places in the accuracy of our measurements. Looking for such accuracy would be ridiculous. One of the quantities to be measured is air pressure. The pressure of a gas is generated by the impact of its molecules on the sides of any containing vessel. That will vary very slightly from moment to moment. The number of molecules striking a unit of area in one second will not be precisely equal to the number striking it in the next, and the molecules will not all have the same speed. A difference of just one in the number of molecules striking a square metre in a particular second would make a much greater difference than 1 in the 100th decimal place. It is not just that there is no imaginable measuring instrument capable of such accuracy; the quantity to be measured cannot even be defined to such an accuracy. There is nothing to measure because there is no 100th decimal place in the value of the air pressure.
Chaotic behaviour can be exhibited by extremely simple systems; I have written a progam to illustrate such a system. The calculation is to double a number and then take the fractional part of the result
Click on the link to run the program. To run it again press the reload button of your browser. To return to this page, press the browser's back button.
Start by running the program with the default number. Then run it again starting with 0.1, which produces a non chaotic cycle through four numbers.
Next consider various approximations to 1/3 (.33, .333, .3333, .33333) Starting the process with the precise fraction 1/3 would produce an alternation of 2/3 and 1/3. However using decimal approximations such as those suggested above produces very different results. The program calculates only to 5 figure accuracy by the way, so entering more than five figures would make no difference.
Short lived pseudo patterns
Chaotic systems frequently appear to show approximate regularity for relatively short time intervals, and then drift away from the pseudo pattern.
Vague predictions are still possible: "The 100 year Flood"
It is wrong to assume that chaos precludes any long term prediction, but what predictions are possible tend to be inconveniently vague. For instance we can predict the magnitude of the 100 year flood, the size of flood that is likely to occur only about once every 100 years; what we can't do is to predict when, in any 100 year period, such a flood will occur.
A system that may be chaotic is human society. In the early days of Social Science some thought is might be given a theoretical structure similar to physical science.
In his book on Education Herbert Spencer wrote:
“Society is made up of individuals; all that is done in society is done by the combined actions of individuals; and therefore, in individual actions only can be found the solutions of social phenomena. But the actions of individuals depend on the laws of their natures; and their actions cannot be understood until these laws are understood. These laws, however, when reduced to their simplest expressions, prove to be corollaries from the laws of body and mind in general. Hence it follows, that biology and psychology are indispensable as interpreters of sociology. Or, to state the conclusions still more simply:- all social phenomena are phenomena of life - are the most complex manifestations of life - must conform to the laws of life - and can be understood only when the laws of life are understood.
That view is now called "scientism" and looked upon with disdain. It envisages the deductions of sociological laws from laws governing the behaviour of individuals. The best example of that method in action is the neoclassical economics of Jevons and Marshall.
Sociologists seem now to concentrate on statistical studies purporting to show patterns in social behaviour. I wonder if they reveal only illusory and fleeting pseudo patterns such as the correlation once noted between sales of bananas and frequency of non-conformist marriages.
It is an oversimplification to think of chaos as a property of certain systems, it is usually just a property of just certain states of systems. Some systems, such as the weather seems always to behave chaotically, but for others chaos is just one of several possible patterns of behaviour. The same system may sometimes approaches a constant state, sometimes shows periodicity, and sometimes shows chaos. Something that behaves chaotically under some conditions may behave in a perfectly orderly way under other conditions. If machinery shows a disposition to behave chaotically, we modify it so that it doesn't do so in normal use.
Many artificial systems have been constructed so that they are not chaotic. Long before chaos was recognised as a well defined state worthy of study, people realised that machinery could sometimes behave erratically, and devised governors and other control mechanisms to prevent that happening.
I find I have to resist the temptation to be carried away with the excitement of discovering chaos and seeing it everywhere that we find it difficult to mke reliable predictions. We must avoid invoking chaos as an excuse for giving up the attempt to predict whenever that is difficult. It is also a mistake to think that chaos is always a problem. If we use the term "chaotic" to describe any system in which errors accumulate over time, there will be some systems called chaotic in which errors accumulate too slowly to inconvenience us. For example the planetary orbits are probably chaotic, but they can still be predicted acturately enough for our purposes for many thousands of years.
It often happens that when a machine is first started it takes a little while to get going properly. A fluorescent light tube flickers for a few seconds, a fan takes a few seconds to reach its normal speed, old televisions sets used to takes ages to "warm up" and, when switched off drew a sine wave on the screen. The initial non-standard behaviour is referred to as a transient. The final stable sate is called the attractor of the system. Examples of types of attractor are:
A stationary state,
Motion with constant velocity,
Constant rotation,
Regular oscillation.
When systems behave chaotically they do not tend to such simple states. Their final states defy simple geometric description and are called strange attractors. A diagram or graph representing a strange attractor is a fractal.
Infinite complexity and Self_Similarity However much one magnifies a fractal the magnified image is just as complex as the original, and the fractal contains parts that resemble the whole. If there are parts congruent to the whole, the fractal is said to display self similarity. If there are merely parts with a general resembalnce to the whole and of the same complexity, the fractal is said to display statistical self similarity
It follows that no actual physical object can quite qualify as a fractal, because matter is composed atoms and, so far as we know, magnifying an atom reveals no more complexity than however many nucleons and electrons compose it. However, many physical objects are approximately fractal, in the sense that there is a fair range over which magnification reveals greater complexity. Often fractal-like objects do not quite satisfy self similarity, but instead show statistical self similarity in which parts of the objects have a general resemblance to the whole without being perfect copies of it.
My first few examples are of mathematical objects so they can really are fractals, and, since they are established by definition, we know them to be such.
The Koch Curve was invented long before fractals were recognised as a subject for study; it was intended to stir things up by questioning common assumptions about the properties of curves, which were assumed to be smooth, except possibly at a few special points. The Koch isn't anything like what most people would normally call a curve because it is composed entirely of corners.
There are actually many possible Koch curves, each one starting from a regular polygon. I consider just the simplest example, which starts with an equilateral triangle, and I shall refer to that just as 'the Koch Curve'
The curve is generated by removing the middle third of each side and replacing it by two additional sides, each one third as long as the original side, and inclined at 60 degrees to it. The procedure is continued indefinitely, and the eventual result is the Koch Curve. The first four stages are ilustrated below

Software to generate the Koch curve, and also a number of other fractals, is available here:
Stricly speaking, the previous explanation is too vague to define anything, since it is impossible to complete an infinite process.
To define the curve precisely, pick out the points that persist. There are some points in the original triangle that are never removed, namely the three original corners, and the two new corners generated when parts of the original sides are trisected. Some of the new points introduced by the process also persist, namely all those that eventually become corner points; every point that does not eventually turn into a corner will eventually be removed.The Koch curve may be defined as the set of persistent points generated by the process, and every such point is a corner.
The Mandelbrot set arises out of a simple calculation with complex numbers.
Perform the iteration, new-z = z2 + c, starting with z = c The Mandelbrot set consists of those values of c for which the iteration converges to zero. The colouring often seen in pictures of the set represents the number of iterations that have to be considered to show that the point in question is in the set.
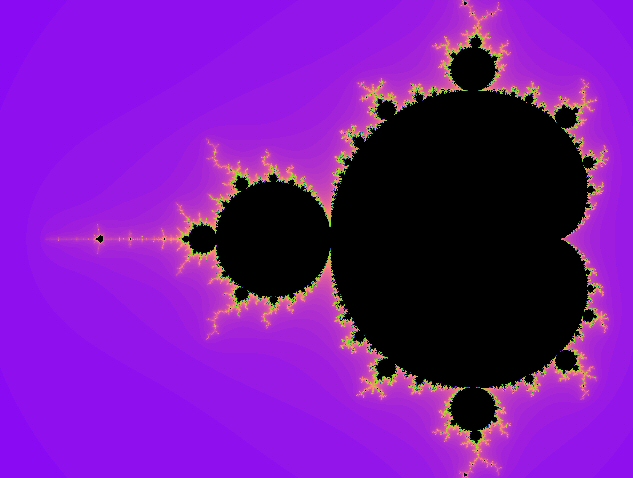 That picture was generated by Fractal Explorer, a program that may be obtained from:
Coastlines and Borders Coastlines and the courses of rivers appear to be fractal, and so do many borders between countries, which often follow natural features such as the courses or former courses of rivers or of old roads that follow contours. The lengths assigned to coastlines and borders therefore depends on the method of measurement, so that different people can obtain markedly different results.
Those figure are about 20 years old; the official data may have been changed since then.
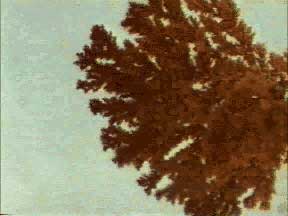
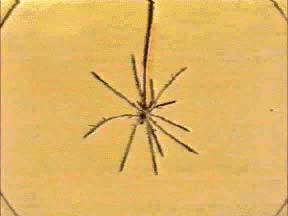
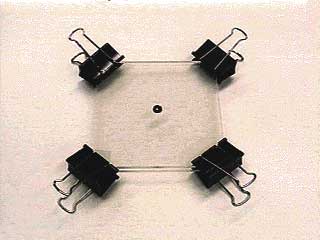
The first two pictures show copper deposited by electrolysis. The second picture is an enlargement of part of the first. The third and fourth pictures show electrolytic deposits of zinc, the fourth being an enlargement of part of the third.
A striking characteristic of fractals is the difficulty of assigning to them any precise size. Most determinations of length, area and volume depend to some extent on the fineness of the measuring method.
Lengths are defined primarily for straight lines, areas for rectangles and volume for cuboids. The definitions of area and volume can fairly easily be extended to plane surfaces bounded by straight lines, and to regions of space bounded by plane surfaces, but it is much harder to deal with lengths of curves, areas enclosed by curves, or volumes enclosed by curved surfaces.
Lengths are particularly difficult.The length of a curve is not even defined in most A Level Maths courses, and the only curves for which a length is usually calculated at that level is the circle, which is introduced to children when they are too young to realise what a huge assumption is being made.
The length of a curve is defined by treating the curve as approximately made up of many small straight line elements. The length obtained by such an approximation will depend on the size of those small elements, but it is hoped that as the elements are made smaller and smaller the successive approximations to the length will settle down to a constant value. That is true for the smooth curves of everyday geometry.
Similar considerations apply to the approximation of an area by successively smaller rectangles, and to the approximation of a volume by successively smaller cuboids.
Each of the ways of measuring size corresponds to what we call the dimension of the object under study. Something whose size is a length is one dimensional, area measures what is two dimensional, and volume what is three dimensional.
If we try to use the wrong sort of approximation, we get either zero or infinity. For instance, if we try to cover a surface with line elements, we can never generate enough elements to cover it, so any attempt to measure the length of a surface produces infinity. If we enclose a surface in elements volume, we find that as the elements become smaller, so does the total volume they enclose and the surface turns out to have zero volume.
For fractals things are more complicated, because there appear to be no satisfactory measures of either length, area or volume, so that it is hard to state the dimension of a fractal.
Consider for example the Koch Curve. The smaller the intervals into which we seek to divide it, the longer that curve appears to be, and that goes on however small we make those elements. The curve seems to have infinite length.
That is supported by consideration of the lengths of the individual figures used to generate the Koch curve. Each step replaces every side in the previous figure by four sides, each of them one third the length of one of the previous sides. So each step in the iteration multiplies the length by 4/3. As the number of iterations, n, tends to infinity, so does (4/3)n
Perhaps the Koch curve isn't really a line at all and has a dimension greater than 1 and ought to be measured not by length but by area.
If we try find an area for the Koch curve,(that means and area for the curve itself, not the for the region it encloses, which has a finite area) it appears to have zero area, suggesting a dimension less than two.
So the Koch curve seems to be too long to be a line, and too diffuse to be a surface. It is assigned a fractal dimension of about 1.26 - I have relegated the details of the calculation to an appendix, but it's possible even at this stage to provide some justification for the use of the word "dimension" by observing that fractal dimension is an extension of the ordinary concept of dimension, because for non fractal objects like smooth curves, rectangles and cubes, the fractal dimension comes out the same as what we'd ordinarily call the dimension, with 1 for lines, 2 for surfaces and 3 for solids.
There is also some support for fractal dimensions from non geometrical considerations. Magnetic relaxation times for structures containing iron atoms is related to the dimension of the structures, and measurements of the magnetic relaxation time for some protein molecules containing iron suggests a dimension of 1.7, corresponding to a very twisted and fractally contorted string.
| coastline of Great Britain | 1.24 | |
| Koch Curve | 1.26 | |
| coastline of Norway | 1.52 | |
| boundary of the Madelbrot set | 2.0 | |
| surfaces of protein moleclues | around 2.4 | |
| clouds | variable around 2.5 | |
| Screwed up paper | 2.5 | |
| Surface of the human brain | 2.79 | |
| Surface of the human lung | 2.97 |
The fractal dimensions of clouds vary considerably. Those in tropical storms can have dimension as high as 2.9, whereas some typhoon clouds have dimension as low as 2.2.
The high fractal dimension of a well screwed up piece of paper explains why waste paper takes up much more space when screwed up than it would if neatly folded
Before trying to define fractal dimension, it helps to reconsider the everyday idea of dimension. There are several ways we can look at that.
It is often convenient to define the dimension of a figure in terms of the minimum number of co-ordinates required to enable us to identify all the points in the figure.
Sometimes people identify dimension by noting what form of meaurement produces a finite answer - length for something one dimensonal, area for something two dimensional, and volume for something three dimension.
But when preparing the way to discuss fractal dimension, it is most convenient to use yet another definition of dimention, the topoloical dimension.
First of all, let us call the figure whose dimension is to be determined F, and imagine a covering of F by a collection of simpler figures. For complete generality it is best to consider a covering by spheres.
By a covering I mean a collection of spheres such that every point of F lies inside at least one sphere. The word inide must be stressed; it is not suficient for a point of the figure to be just on the surface of one of the covering spheres, it must actually be inside a sphere.
Some points in F may lie inside several spheres; indeed it is usually impossible to construct a covering without at least some points lying inside more than one sphere.
If F lies entiely in a plane, we can simplify the matter by using circles instead of spheres. As an exercise, draw a curve on a piece of paper and construct a covering with circles. Now draw a triangle and constuct a covering of region inside it.
To determine the topological dimension of F, we attempt to minimize the number of covering spheres that overlap at any point of F, and note what that minimum number is. Try to do that with the circles on your own diagram.
Once you have your covering with minimum overlaps, find the greatest number of speres in the covering to which any single point in F belongs. Subtact one from that greatest number, and the answer is the topological dimension
If it is possible to have a covering with no overlaps, no point in F belongs to more than one sphere so the object is of zero dimension - that is the case for a point or a set of isolated points.
You should find that to cover the curve in your sketch with cicles requires that there are some points belonging to two circles, but it is possible to arrange things so no point lies inside than two of the covering circles, so the topological dimension of the curve = 2 - 1 = 1.
To cover the whole of the inside of your triangle will be impossible unless there are places where three circles overlap, but it is possible to avoid any greater number overlapping, so the topological dimension of the inside of the triangle = 3 - 1 = 2, as we should expect.
If it is impossible to avoid contact or overlap, but it is nowhere necessary for more than two sphere to touch or overlap at the same point, then the object is of topological dimension 1; that is the case with a line or curve.
If it is necessary to allow three spheres in some places, but never necessary to allow more to overlap, the topological dimension is two.
If it is necessary to allow four, but never more than four, spheres to overlap in some places, then the structure is of topological dimension 3.
For objects of dimension less than 3, a covering with circles would suffice
Several definitions have been offered. I describe what is called the 'box covering method' because I find it the easiest.
Once again we consider a covering, but of a different sort and with a diferent object. The coverings used to define topological dimension used spheres of no particular size; indeed the procedure did not assume any method of measurement - it was after all a quantity called topological dimension that we were defining. And in the case of topological dimension, we insisted that each point in F should lie inside at least one of the covering spheres, and then we minimised the number of spheres overlapping at any point.
To define fractal dimension, on the other hand, we consider coverings using spheres all of the same size, and this time it does not matter whether a point lies inside or on the surface of a covering sphere, and what we minimise is not the number of overlaps, but the total number of spheres in the covering
We then investigate how the minimum number of spheres needed to cover figure F would change if the sizes of the spheres were changed
Incidentally, the covering does not have to use spheres; it is possible to use cubes, or any set of congruent convex polyhedra. I've chosen to state the argument in terms of spheres to avoid having to discuss the orientation of the covering boxes.
For the simple figures of elementary Mathematics the number of spheres needed is quite simply related to the size of each sphere and the topological dimension of the figure.
For a straight line, the number a spheres is inversely proportion to their radius.
For the inside of a polygon or closed curve hat encloses a clearly defined area, the number of spheres is inversely proportional to the square of the radius of each sphere.
For the inside of a polyhedron or other figure enclosing a clearly defined volume, the number of spheres is inversely proportional to the cube of the radius of each covering sphere.
We generalise that observation by defining the fractal dimension of a figure F as the number d such that, as r tends to zero,
the minimum number of spheres of radius r needed to cover F is proportional to r-d
For the Koch curve it is easiest to start with spheres (or in this case circles would suffice) of diameter equal to a side of the initial triangle, so the radius is half the length of a side, and then to divide the radii by 3 at each stage.
Each time we divide the radii of the covering spheres by 3, the minumum number of covering spheres needed is multiplied by 4, hence the fractal dimention, d of the Koch curve is given by:
(1/3)-d = 4 so 3d = 4, giving d = log(4)/log(3) = 1.26...
Having defined fractal dimension, we can now define a fractal as a figure with fractal dimension greater than its topological dimention.